

How it works
Tell it which property
Enter the titles. Map picking and boundary upload are planned for launch.
It finds and clips the layers
Title boundaries, erosion susceptibility, LUC, LiDAR slope, indigenous cover and protected areas: found, clipped to your boundary and styled. Usually two to three minutes.
You download the results
A link arrives by email: the GIS pack ready for QGIS or ArcGIS Pro, and a PDF report with the slash assessment for the client file. No account needed.
What you get
The layers you would otherwise build by hand
Every public layer that bears on the property, found, clipped to the boundary and symbolised, with slope and harvest terrain rasters from the 1 m LiDAR model wherever LINZ LiDAR exists, about 80% of New Zealand.
- Boundary, erosion susceptibility zones and the harvest assessable area
- 1 m slope model, with ground steeper than 25° mapped
- Harvest terrain classes
- Indigenous forest and protected land netted off to an operable area
- NZTM 2000 throughout, with styles included
QGISArcGIS ProGeoPackageGeoTIFF
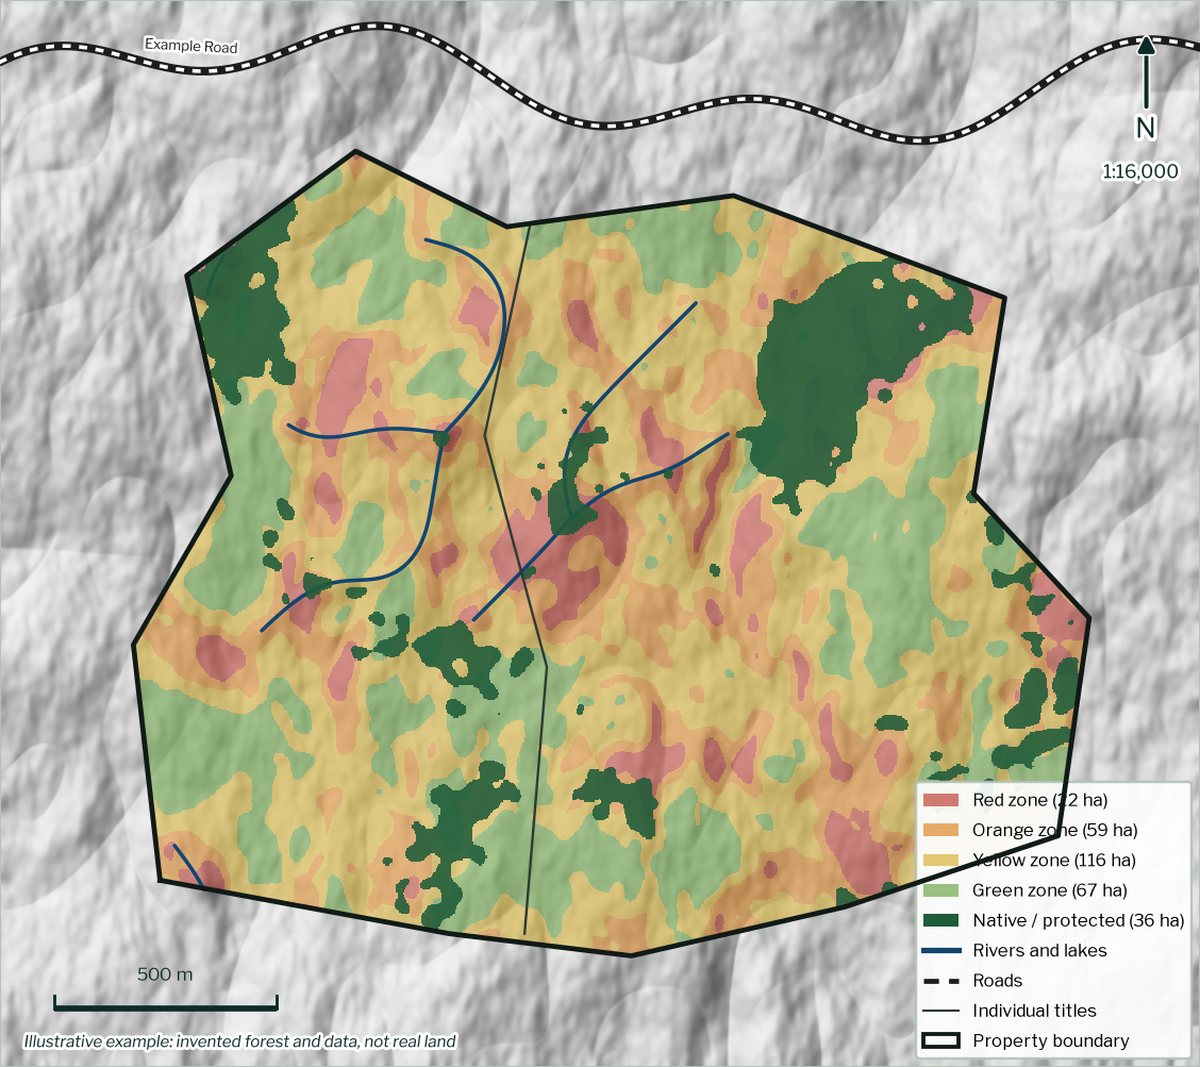
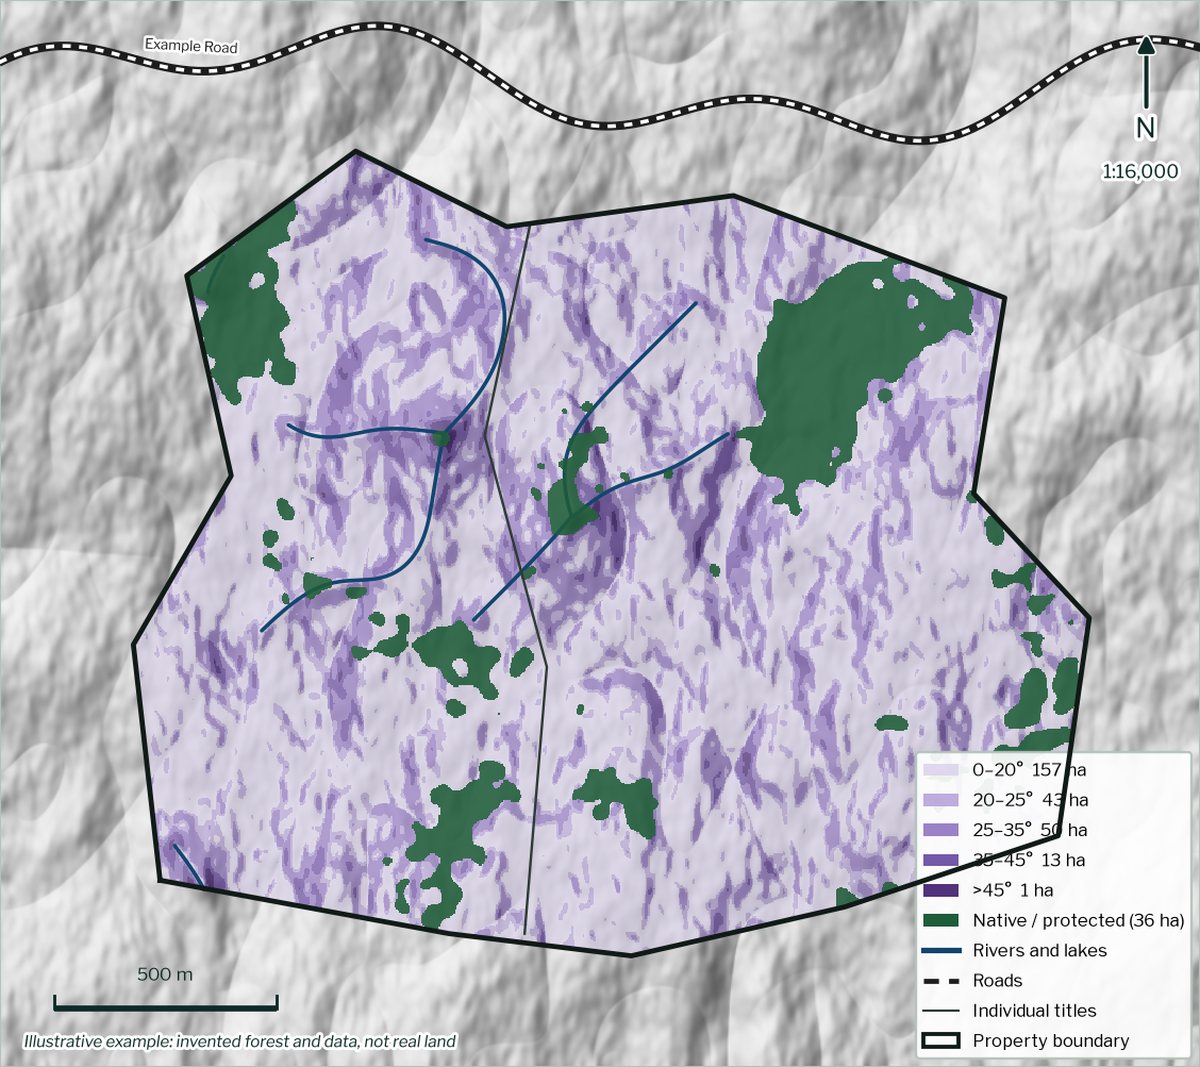
The one NES-CF assessment public data can drive
The slash mobilisation risk assessment, regulation 69(5) and Schedule 2 item 16: the one regulatory finding a boundary and public data can genuinely determine, and the one that can make harvesting a controlled activity. Shown on the map with the ground that drives it.
Now nationwide. Until October 2026 the South Island and Marlborough could not be assessed at all: the erosion data was published region by region and existed for only seven of the twelve. Manaaki Whenua's national LUC extended legend covers all twelve, so the assessment runs anywhere. A small number of Marlborough Sounds units are still unmatched, and the report reports those as gaps rather than as a clean pass. The GIS pack works nationally. Where there is no LiDAR, slope cannot be read, and the report says so rather than reporting no risk.
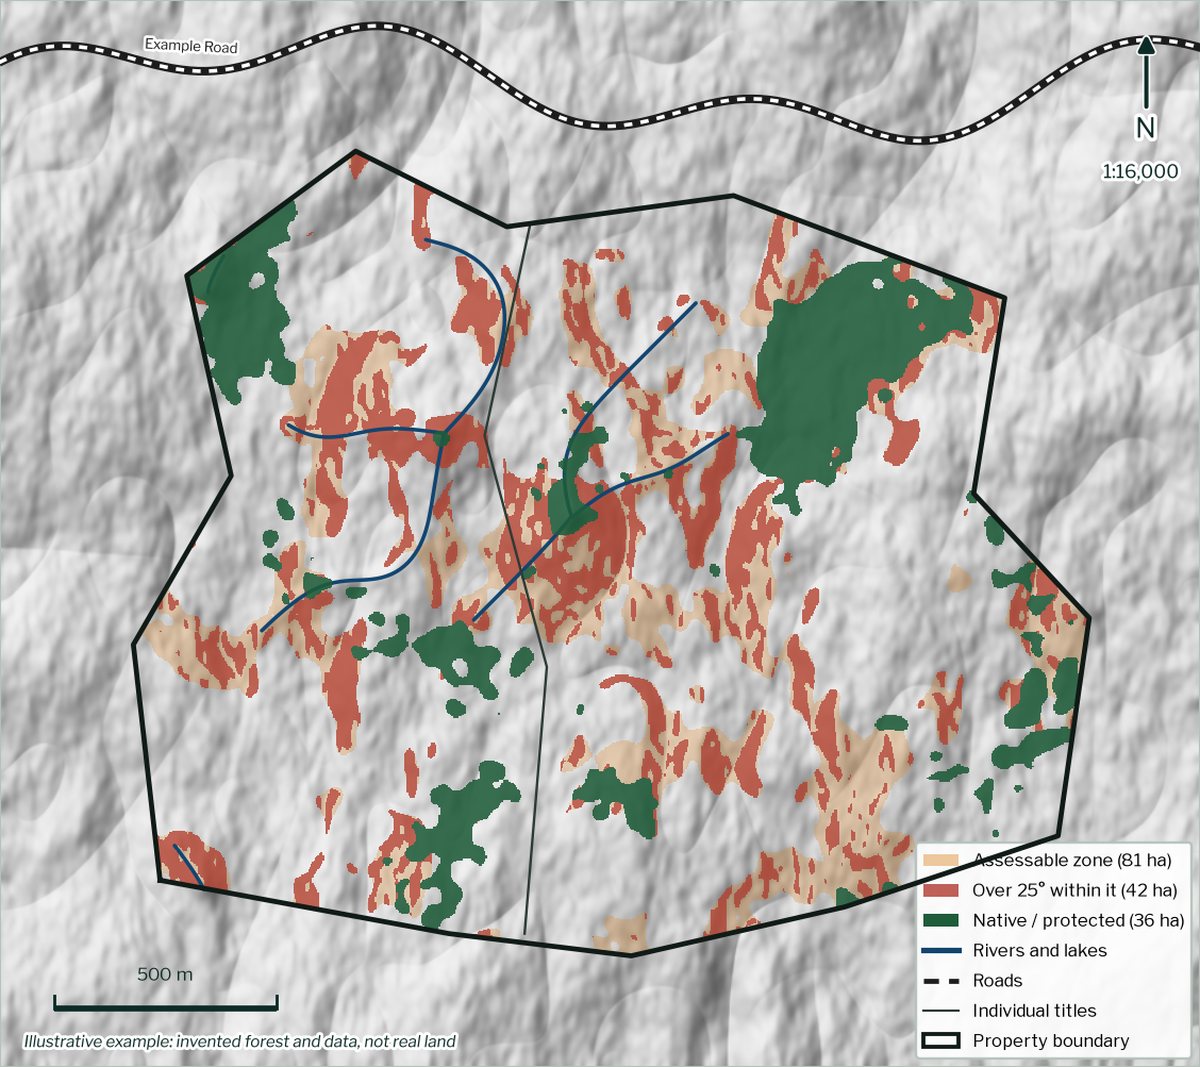
What the regulations say about the property, with every citation and the verbatim text it was read from. Useful background for the file. It is context, not a compliance check.
Example maps of an invented forest, drawn in the same style as the report. They show no real land and use no real data.
What ForestCheck is not
- Not a compliance check, and not consent advice.
- It does not tell you whether earthworks, land preparation or a river crossing need resource consent.
- Not a substitute for a planner, a forestry consultant or the council.
Who it is for
Forestry consultants, forest managers and valuers who pull this information together for purchases, harvest planning and planting proposals — often several times a month, from several different government and council websites.
Register your interest
ForestCheck is being tested against real assessments before it opens. Leave your email and you will hear when it does — nothing else, and you can ask to be removed at any time.
The two questions about your work are optional. They help decide what gets built first.
Questions
Is this planning advice?
No. It is automated analysis of publicly available data, plus the one NES-CF assessment that data can drive. It is not a compliance check and not consent advice, and it does not replace a planner, a forestry consultant or the council.
Where does the data come from?
Public government sources: Toitū Te Whenua LINZ, the Ministry for Primary Industries, Manaaki Whenua – Landcare Research and Stats NZ. Every figure in the report states the source it came from.
Which regions does it cover?
The national layers cover all of New Zealand, and since October 2026 so does the slash assessment: all twelve NZLRI regions, the South Island and Marlborough included. A small number of Marlborough Sounds units are still unmatched and are reported as gaps rather than passes. Council-specific rules vary, and the report says where the district or regional plan needs checking.
When will it open?
When the testing against real assessments is finished. Register above and you will be told first.